One point is a dot. Two points make a line. Three points make a trend.

Workforce numbers your whole contact center agrees on.

Interval computes adherence, occupancy, shrinkage, and forecast variance from your Amazon Connect data using published definitions, then explains a missed service level in shares. Built for operations running 20 to 300 agents on Connect.

No new telephony integration. Interval runs on the contact records, agent event streams, and queue metrics Connect already produces, inside your AWS account.
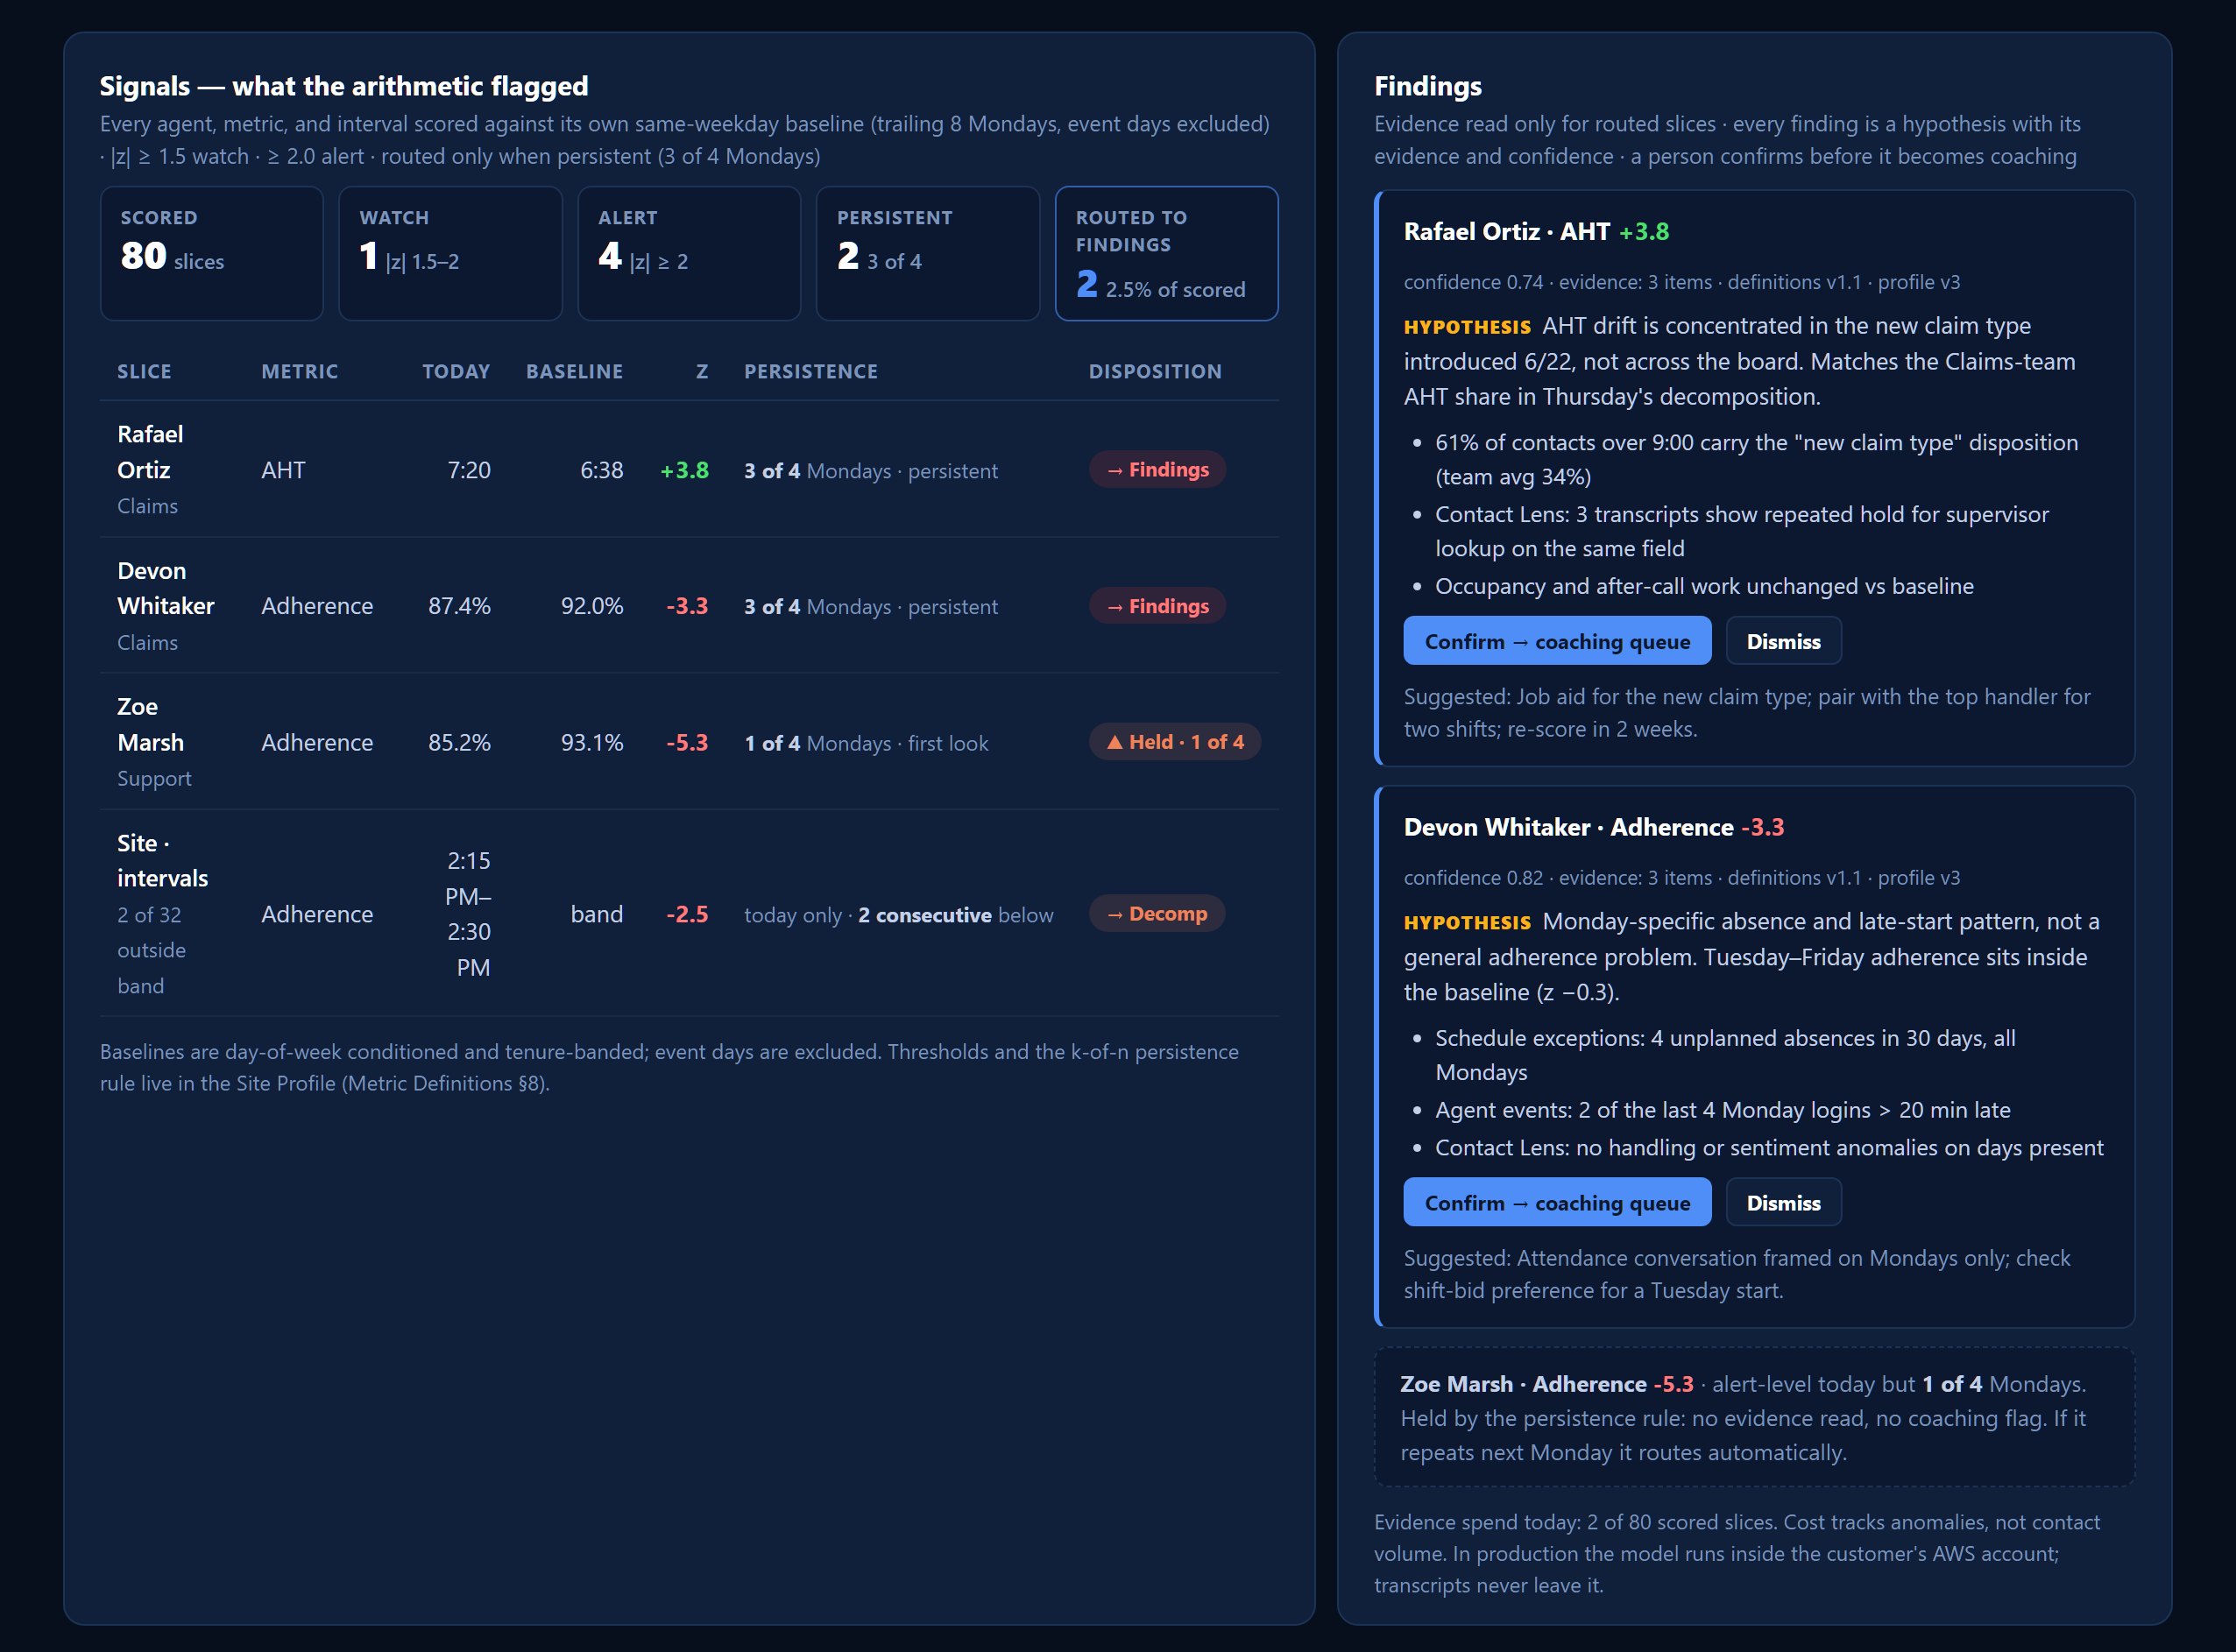
Interval dashboard: Signals card showing scored slices, flagged agents, and routed findings
Signals and Findings on the demo dataset. Every flagged slice shows today's value, its baseline, the z-score, and persistence.
Amazon Connect native Power BI delivery in your tenant Data stays in your AWS account Definitions published and versioned

Three things the spreadsheets and the suite both miss

Teams between 20 and 300 agents are too large to run the floor by feel and too small for a six-figure workforce suite. Adherence ends up in exports, shrinkage is estimated, and the forecast is never scored against what happened.

Definitions you can read

Each metric has one published formula, versioned, and configured per site through a Site Profile: your agent state taxonomy, channel concurrency, shrinkage categories, targets, and event calendar. A supervisor, a Power BI report, and an AI copilot all get the same number.

Decomp: why service level missed

When a day misses target, the gap is attributed arithmetically into named shares: volume over forecast, absence, handle time, and adherence. The method is deterministic and reproducible, and each share comes with a suggested action.

Findings: read only the exceptions

Every agent, interval, and queue is scored against its own same-weekday baseline. Only deviations that persist get an evidence read. Each finding carries its evidence and a confidence, and a person confirms it before it becomes coaching.

How it works

Three steps from raw Connect data to numbers the Monday meeting can start from.

1

Connect the data

Contact records, agent event streams, and queue metrics arrive through Kinesis or S3 in your AWS account. Schedules come in by CSV import with a mapping wizard that rejects unmapped states instead of guessing.

2

Set the Site Profile

The only per-site configuration: state taxonomy, channel classes and concurrency, shrinkage rules, service targets, time zone, and the event calendar that baselines exclude. Versioned, with the expected numeric impact of each change recorded.

3

Get the numbers

Power BI reports delivered in your tenant, Decomp on every missed day, and Findings on the exceptions. An endpoint for copilots is on the roadmap so "why did Thursday miss" gets the same answer from any assistant.

The definitions, in one place

Interval ships with a definitions document. The summary below is what the Monday argument is usually about.

MetricDefinition (summary)Grain
AdherenceMinutes in a scheduled-allowed state divided by scheduled minutes, with allowed-state sets per activity from the Site Profile.15-minute interval, rolled up to agent, team, day
OccupancyVoice: handle time over handle plus available time. Chat: slot model using the channel's concurrency capacity. Deferred work: utilization of scheduled work time.Interval by channel
ShrinkagePlanned (breaks, training, meetings) and unplanned (absence, tardiness, extended breaks) hours as a share of scheduled hours, categorized by the Site Profile taxonomy.Day and week
Forecast varianceActual minus forecast as a share of forecast. Assessed two ways: daily variance and weekly bias, with small-denominator intervals excluded.Interval, day, week
DecompOne-at-a-time substitution against the plan requirement for volume, absence, handle time, and adherence; interaction effects allocated proportionally so shares sum to the miss.Any missed day
SignalsDay-of-week conditioned z-scores against a trailing baseline of the same weekday (event days excluded; agents compared within tenure bands). Watch at 1.5, alert at 2.0, routed only when persistent.Agent, queue, interval

Definitions document version 1.1. Every report and finding is stamped with the definitions version and Site Profile version it was computed under.

Pricing

Two ways to use Interval. Both start with the same definitions.

Early access

Interval Kit

From $499 per site, one-time
For teams with a Power BI analyst who want the definitions and reports in their own tenant.
  • Power BI template for Amazon Connect
  • Measure library implementing the published definitions
  • Site Profile template and schedule import wizard
  • Decomp and Signals pages
  • Definitions document and update notes
Request the Kit
Design partners

Interval Engine

Per agent per month, founding pricing for partners
For operations that want the metric engine run for them, with Findings, inside their AWS account.
  • Hosted metric engine with the Site Profile as the only configuration
  • Decomp on every missed day
  • Findings with evidence, confidence, and effect tracking
  • Reports delivered in your Power BI tenant
  • Three to five founding partner slots, built against your real data
Request a partner slot

Questions we get

Does Interval schedule agents?

No. Keep whatever you schedule with. Interval measures and explains: where the plan and reality diverge, and what it cost. Schedules come in by CSV import.

Where does our data live?

In your AWS account. Interval reads Connect contact records, agent events, and queue metrics from your Kinesis or S3 landing, and reports are delivered in your Power BI tenant. Findings runs its evidence reads through Amazon Bedrock in your account, so transcripts never leave it.

Which platforms are supported?

Amazon Connect first. Adapters for Genesys Cloud and Five9 are planned; the Site Profile and definitions are platform-independent by design.

Is there AI in it?

The numbers are arithmetic. Findings uses a language model only to read evidence for the small share of slices the statistics flag, and every output is labeled as a hypothesis with its evidence and a confidence. A person confirms a finding before it becomes a coaching action.

How is the demo data generated?

The demo is synthetic and deterministic, generated in the browser. It exists to show the definitions, Decomp, Signals, and Findings working end to end. No customer data is involved.

Who builds Interval

Interval is built in Somerset, Kentucky by a workforce-management and business-intelligence practitioner with more than twelve years in contact-center operations, including the reporting and WFM automation behind an omnichannel operation serving about 1,500 institutional clients, and daily work in Amazon Connect data, Snowflake, and Power BI.

Every definition in the product has survived contact with a real operations floor. Consulting engagements run through Ethelytics.

Request early access

Tell us how many agents you run on Connect, what you schedule with today, and the workforce question you cannot answer. We reply within two business days.

Email Interval